
Does force weight keep moving the H2+ crossover in Rana et al.'s 1/R scheme?
Abstract
Rana, Manoj, Lourderaj, and Sathyamurthy, in Artificial Neural Networks Fitting of Potential Energy Curves and Surfaces: The 1/R Conundrum (2025), proposed fitting molecular potentials by subtracting the exact nuclear-repulsion energy, fitting the remaining electronic energy, and restoring the exact term afterward.1 A preceding H\(_2^+\) experiment here found that adding force labels at one loss weight moved the first tested bond-distance cutoff where the direct fit reached parity with the subtraction fit. This independent implementation asks whether that shift continues monotonically as the standardized force-loss weight rises. I swept \(\lambda = 0\) to \(100\) with the same analytic curve, 15-unit network, five folds, five initializations, and 20,000-step optimizer budget, then repeated the two first-crossing endpoints at \(\lambda=0,1,100\) for 40,000 steps as a preregistered optimization audit. The primary first-parity sequence moved sharply inward at the smallest positive weight, then outward at larger weights; \(\lambda=100\) crossed parity 3 times. But 3 of 6 audit endpoints changed sides of parity when the training budget doubled. The registered verdict is therefore inconclusive, not falsified: this experiment did not establish a training-budget-stable dose response. It does establish a practical warning for this model—the apparent Coulomb-subtraction crossover is sensitive to optimization depth as well as to the energy/force weighting being studied.
Introduction
A molecular potential separates into an electronic contribution and an exactly known nuclear repulsion,
\[ V(\mathbf R)=E_{\mathrm{el}}(\mathbf R)+V_{\mathrm{NN}}(\mathbf R), \qquad V_{\mathrm{NN}}=\sum_{A<B}\frac{Z_AZ_B}{R_{AB}}. \]
The second term diverges when nuclei approach. A neural network trained directly on \(V\) must spend capacity representing that wall even though its form is known. Rana and co-workers called this the \(1/R\) conundrum and proposed removing \(V_{\mathrm{NN}}\) from the learned target, fitting \(E_{\mathrm{el}}\), and adding the exact term back to the prediction.1
The first experiment in this series asked where that subtraction helps. On a controlled one-electron H\(_2^+\) curve, the answer depended on the fitted domain: exact subtraction strongly helped a small network when the domain included the repulsive wall, but the direct total-energy fit caught up after the short-range region was excluded. The next experiment asked whether force training moves that crossover. At the single tested force weight \(\lambda=1\), it moved inward from the energy-only result rather than outward as predicted.
One dose does not reveal a dose response. The inward displacement could be the start of a monotonic trend, a change that saturates immediately, or one point on a nonmonotonic curve. The distinction matters because an energy-plus-force objective does two things at once. It supplies local shape information, but it also changes the optimization landscape. Against the H\(_2^+\) wall, Scheme A must learn both \(1/R\) in energy and \(1/R^2\) in the derivative, while Scheme B removes both exact contributions. Larger force weight might therefore push parity inward by helping the direct fit away from the wall, or outward by increasing its short-range burden.
The registered hypothesis was specific: the first tested parity cutoff \(C(\lambda)\) would be nonincreasing over \(\lambda\in\{0,0.01,0.1,1,10,100\}\), at least one weight above \(1\) would move strictly inward of the \(\lambda=1\) result, and no positive-weight curve would cross back after reaching parity. An outward step, a flat high-weight response, or a reverse crossing would falsify that hypothesis—unless a method-fidelity gate failed, in which case the verdict would be inconclusive. The contribution is a matched four-decade force-weight sweep with 0.25-bohr crossover brackets, including a frozen doubled-budget audit. Rana et al. report neither this dose response nor this analytic test; no program, code, or data from their work were used.
Computational Methods
Reference curve. The target is the same closed-form, minimal-basis LCAO-MO H\(_2^+\) ground-state curve used by the force-training precursor. With one \(1s\) Slater function of exponent \(\zeta=1\) on each proton, the symmetric orbital follows standard expressions for the overlap, Coulomb, and exchange integrals.2
\[ S=e^{-R}\!\left(1+R+\frac{R^2}{3}\right),\quad J=\frac1R-e^{-2R}\!\left(1+\frac1R\right),\quad K=e^{-R}(1+R), \]
\[ E_{\mathrm{el}}(R)=-\frac12-\frac{J+K}{1+S}, \qquad V(R)=E_{\mathrm{el}}(R)+\frac1R. \]
The curve and its analytic derivative are evaluated at 401 geometrically spaced distances from \(0.15\) to \(20\,a_0\). This is a deliberately small one-electron model, not a quantitative ab initio benchmark. It supplies a smooth electronic term, an exact repulsive wall, and a calculation small enough to rerun end to end on a laptop CPU.
Targets and loss. Scheme A fits total energy \(V(R)\) and its slope directly. Scheme B fits \(E_{\mathrm{el}}(R)\) and its slope, then restores \(1/R\) in the energy and \(-1/R^2\) in the slope before scoring total-energy and total-force errors. For each training fold, distance, value, and slope targets are standardized exactly as in the precursor. The objective is
\[ L=\operatorname{MSE}(\text{standardized energy}) +\lambda\operatorname{MSE}(\text{standardized slope}). \]
Because the derivative is with respect to standardized distance, \(\lambda\) is a standardized-coordinate loss weight, not one fixed physical force coefficient. Its physical-coordinate multiplier is proportional to \(\lambda\sigma_R^2\), and the fold-specific values are preserved in the result artifact.
Dose and cutoff panels. The force weights were frozen at \(\{0,0.01,0.1,1,10,100\}\). The primary lower-distance cutoffs were \(0.15\,a_0\) and every \(0.25\,a_0\) from \(1.00\) through \(3.50\,a_0\). The isolated shortest cutoff retained the near-wall stress test; the fine grid bracketed the two precursor crossovers and could expose a later reversal. Three additional old cutoffs were run only at \(\lambda=0\) and \(1\) to check exact implementation continuity and did not enter the new dose-response analysis.
Network, pairing, and score. Every fit used a one-hidden-layer network with 15 tanh units and a linear output in float64. Full-batch Adam ran for 20,000 steps with cosine learning-rate decay from \(10^{-3}\) to \(10^{-5}\); the lowest-training-objective checkpoint was retained. Five fixed stratified folds and initialization seeds 11, 29, 47, 71, and 101 were shared across weights, cutoffs, and schemes. Schemes A and B began from identical weights within each seed-fold pair. The primary score for each seed was pooled out-of-fold total energy RMSE, and the cutoff statistic was the median of the five paired \(\mathrm{RMSE}_A/\mathrm{RMSE}_B\) ratios. Held-out total-force RMSE was recorded as a secondary score.
The first tested parity cutoff \(C(\lambda)\) is the smallest \(R_{\min}\) at which the median energy ratio is at most one. The adjacent sampled cutoffs are the reported bracket; a log-ratio interpolation is descriptive only and never enters the verdict. All later forward and reverse crossings are retained, so a curve that recrosses does not masquerade as one permanent boundary.
Frozen fidelity gates. Analytic identities, derivatives, batched gradients, and spawned-worker isolation were checked before production. The wrapper imports the predecessor trainer unchanged and retained its 25-network batch shape. Its \(\lambda=0\) and \(1\) results had to equal all 160 committed predecessor RMSEs exactly. Every output had to be finite and independently re-derived from the raw per-seed values.
The optimization audit was also fixed before outcomes were viewed. At \(\lambda=0,1,100\), the two sampled endpoints around the primary first crossing were rerun for 40,000 steps. If any endpoint changed sides of \(\mathrm{RMSE}_A/\mathrm{RMSE}_B=1\), the dose response was declared optimization-sensitive and the scientific verdict became inconclusive, regardless of the primary pattern. A three-hour wall-clock ceiling provided a separate stopping rule.
Execution and traceability. Two scalar-\(\lambda\) processes ran concurrently, each with numerical-library thread counts fixed at one, on an Intel i7-1165G7 CPU under Ubuntu 24.04.4 on x86_64. The temporary production environment used Conda 25.3.1, CPython 3.12.3, and NumPy 2.4.4; its explicit Linux base and pinned Python package set are committed beside the results. The production artifact fingerprints the imported model, trainer, and predecessor results. A Python-standard-library verifier reconstructs all artifact-derived summaries, post-run gates, and the verdict without NumPy or retraining. This is an independent implementation: no program, source code, or data from Rana et al. entered the calculation. The full primary sweep and audit took 70.7 minutes, within the registered ceiling.
Results
The 20,000-step first-parity cutoffs and sampled brackets are listed in Table 1.
Table 1. First sampled cutoff at which the median paired energy-RMSE ratio was at most one after 20,000 steps. A bracket joins adjacent tested cutoffs and is a resolution interval, not an uncertainty interval. Crossing count includes later reverse and forward recrossings.
| standardized \(\lambda\) | first parity bracket (\(a_0\)) | \(C(\lambda)\) (\(a_0\)) | crossing count |
|---|---|---|---|
| 0 | 2.75–3.00 | 3.00 | 1 |
| 0.01 | 1.25–1.50 | 1.50 | 1 |
| 0.1 | 1.25–1.50 | 1.50 | 1 |
| 1 | 1.50–1.75 | 1.75 | 1 |
| 10 | 1.75–2.00 | 2.00 | 1 |
| 100 | 1.75–2.00 | 2.00 | 3 |
The sequence fell from 3.00 \(a_0\) at \(\lambda=0\) to 1.50 \(a_0\) at \(0.01\), remained there at \(0.1\), then rose to 1.75 \(a_0\) at \(1\) and 2.00 \(a_0\) at \(10\). At \(\lambda=100\), the first crossing occurred over 1.75–2.00 \(a_0\), the ratio crossed back over 2.75–3.00 \(a_0\), and crossed forward again over 3.00–3.25 \(a_0\). Figure 1 juxtaposes that primary pattern with the doubled-budget endpoint audit.
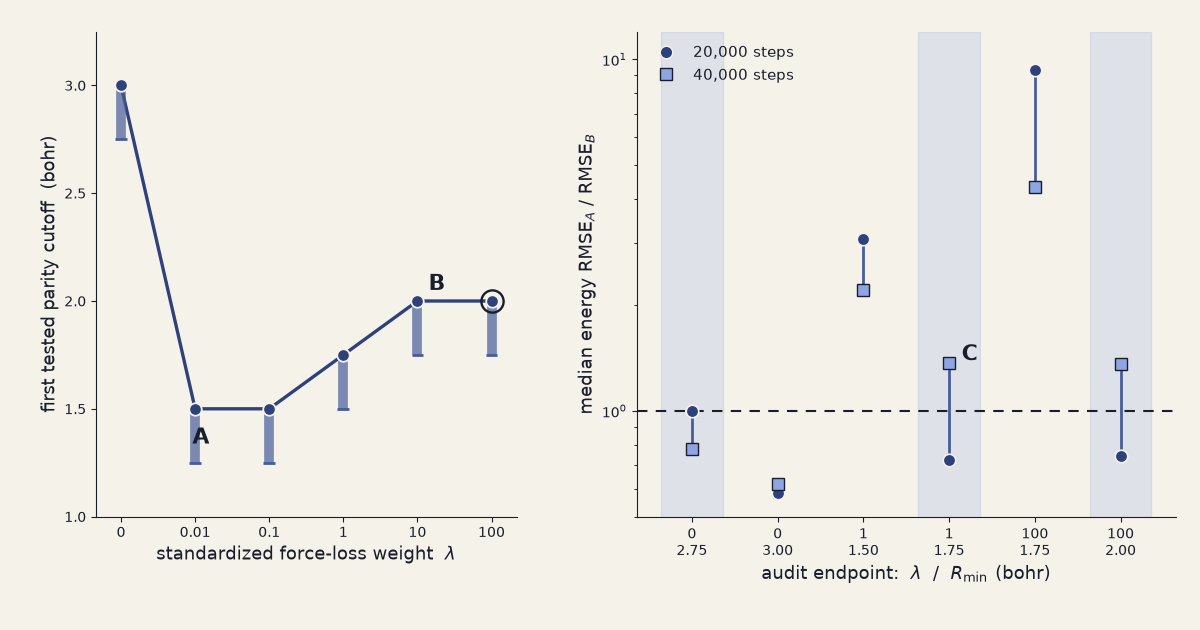
Figure 1. The left panel shows the registered 20,000-step first-parity cutoff; vertical segments are adjacent sampled cutoffs bracketing parity, not uncertainty intervals. A marks the large inward step at the first positive weight, and B marks the later outward movement. The hollow \(\lambda=100\) marker denotes that its curve later crossed back. In the right panel, circles are primary ratios, squares are doubled-budget ratios, the dashed line is A/B parity, and shaded columns changed classification at the six preregistered 40,000-step audit endpoints. C marks one of the 3 changes among 6 endpoints.
Table 2 gives the audit ratios. 3 classifications changed: the \(\lambda=0\), \(2.75\,a_0\) endpoint moved from just above parity to below it; the \(\lambda=1\), \(1.75\,a_0\) and \(\lambda=100\), \(2.00\,a_0\) endpoints moved from below parity to above it.
Table 2. Registered optimization-sensitivity audit. Each value is the median of five paired total-energy RMSE ratios. “Same side” asks whether the 20,000- and 40,000-step values occupy the same side of A/B = 1.
| \(\lambda\) | \(R_{\min}\) (\(a_0\)) | ratio at 20,000 steps | ratio at 40,000 steps | same side of parity |
|---|---|---|---|---|
| 0 | 2.75 | 1.0001 | 0.7769 | false |
| 0 | 3.00 | 0.5831 | 0.6206 | true |
| 1 | 1.50 | 3.0722 | 2.2066 | true |
| 1 | 1.75 | 0.7259 | 1.3677 | false |
| 100 | 1.75 | 9.3079 | 4.3394 | true |
| 100 | 2.00 | 0.7429 | 1.3570 | false |
The near-wall energy ratio rose from 5.34×10¹ at \(\lambda=0\) to 9.99×10⁴ at \(\lambda=100\); the corresponding held-out force ratios were 1.57×10² and 2.07×10³. Across those two weight endpoints, the median direct-fit energy RMSE changed from 2.71×10⁴ to 6.91×10⁶ cm\(^{-1}\), while the Coulomb-subtracted energy RMSE changed from 5.25×10² to 7.17×10¹ cm\(^{-1}\). Direct-fit total-force RMSE changed from 4.083×10⁰ to 1.840×10⁰ hartree/bohr; the Coulomb-subtracted values were 2.647×10⁻² and 9.266×10⁻⁴ hartree/bohr.
All 160 predecessor comparisons were exact, with a maximum absolute difference of 0.0 cm\(^{-1}\). The completeness, finiteness, independent-analysis, source-fingerprint, and runtime checks passed. The optimization audit did not.
Discussion
The registered scientific verdict is inconclusive. The primary pattern alone would have falsified every part of the monotonic-dose hypothesis: \(C(\lambda)\) turned outward above \(\lambda=0.1\), neither high weight lay inward of \(\lambda=1\), and the \(\lambda=100\) curve reverse-crossed. But the protocol gave method-fidelity gates precedence over that pattern. Since doubling the training budget changed which scheme won at 3 registered endpoints, the experiment did not establish that those first-parity cutoffs are stable properties of the loss weights.
The flips are not all marginal. The \(\lambda=0\) endpoint began almost exactly at parity, so its change is unsurprising at the chosen resolution. At \(\lambda=1\) and \(100\), however, the 20,000-step ratios were clearly below one and the 40,000-step ratios clearly above it. These are deterministic optimizer-budget effects under fixed folds and seeds, not resampling noise. A different fixed step count would change the reported boundary and could change the apparent shape of the dose response.
That result changes how the earlier \(\lambda=1\) crossover should be read. Exact reproduction of the predecessor values proves that the new wrapper did not silently alter that calculation. It does not prove those values represent converged comparisons. The doubled-budget audit shows that “same implementation” and “optimization-stable scientific quantity” are separate standards.
The near-wall results still expose a pronounced fixed-budget stress pattern. Between the \(\lambda=0\) and \(100\) endpoints, absolute force RMSE improved in both schemes, especially after exact subtraction. Over the same endpoints the direct scheme’s energy RMSE worsened by orders of magnitude while the subtraction scheme’s energy RMSE fell; the energy A/B gap reached 9.99×10⁴. Large standardized force weight was therefore not simply buying proportionate force improvement; it also damaged the direct energy fit. Because energy and force rankings can diverge, an energy-defined crossover should not be read as a universal boundary between “better” and “worse” potentials.
The audit has a deliberately narrow interpretation. It sampled only the two registered endpoints around the primary first crossing at three weights. It is not a replacement 40,000-step dose-response curve, and it cannot locate new crossovers. Nor does this one-electron, one-coordinate model establish behavior for ab initio targets, larger networks, alternative energy/force normalization, many-atom potentials, or molecular dynamics. Five initialization seeds expose deterministic sensitivity to starting weights; they are not a statistical population from which to claim broad confidence intervals.
What the experiment contributes is therefore diagnostic rather than directional: under this architecture and optimizer, crossover location is entangled with training depth. A future dose-response experiment should make optimization depth an explicit axis rather than a pass/fail appendix—save matched learning curves, define a convergence criterion before running, and fully sweep representative low, intermediate, and high weights only after their scheme comparison has stabilized.
Conclusion
Increasing the force-loss weight did not yield a stable monotonic answer in this H\(_2^+\) test. The 20,000-step sweep appeared strongly nonmonotonic, including a reverse crossing at the highest weight, but the preregistered 40,000-step audit changed parity at 3 of 6 endpoints. The honest outcome is inconclusive: the optimization budget moved the apparent Coulomb-subtraction crossover enough to prevent a dose-response claim. The next useful experiment is not another weight on the same fixed budget; it is a convergence-mapped comparison in which training depth is part of the registered design.
If you find an error in the implementation, artifact, or interpretation, please send the exact failing check or counterexample so the record can be corrected.