
From a Prompt to a Polished Excel Workbook with Codex and Sol
The interesting part of AI-assisted spreadsheet automation is not that a model can emit a few formulas. It is that a person can now describe the workbook they need in ordinary language, let an agent assemble the code and file, and then inspect a serious deliverable: source data, tables, formulas, charts, documentation, and validation included.
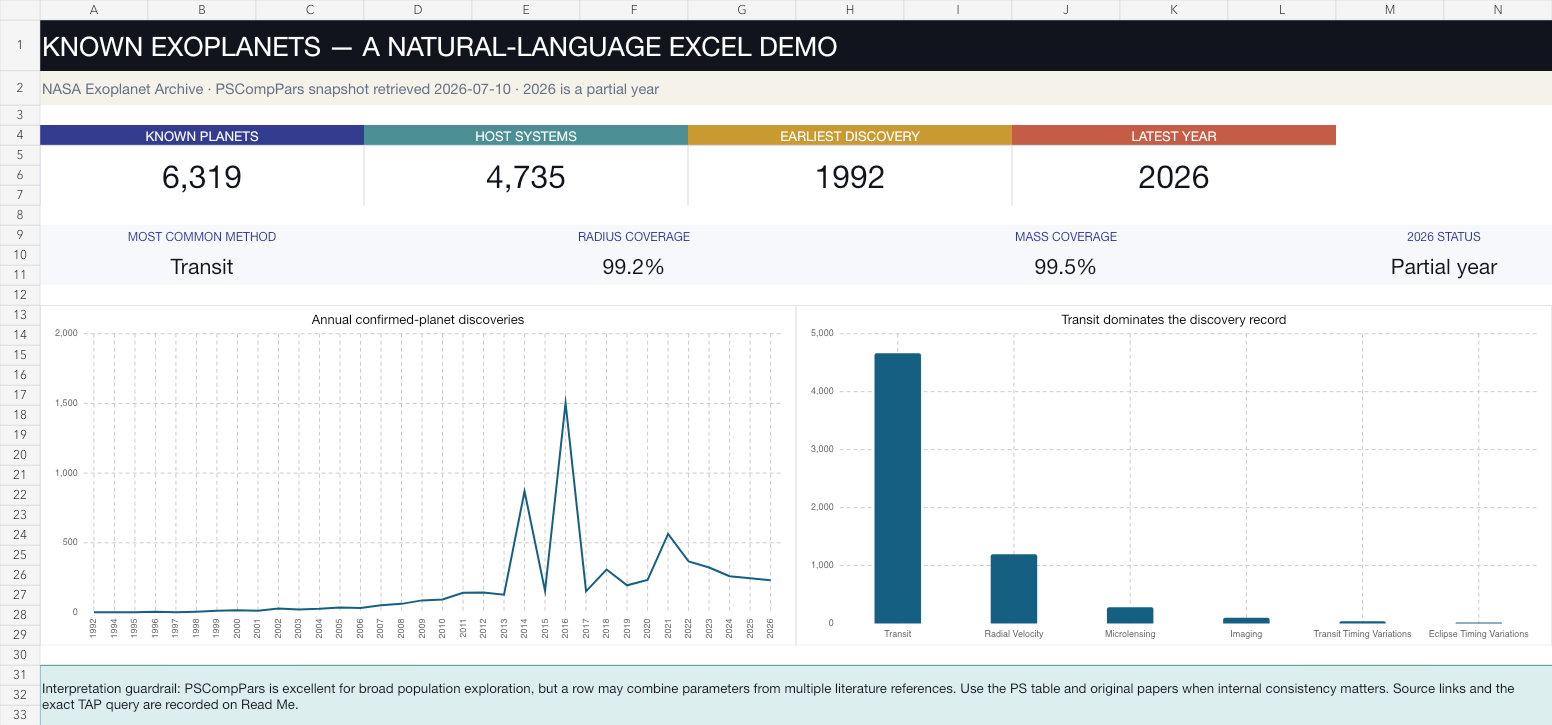
I wanted to test that claim on something less forgiving than a toy sales table. I asked Codex to use a documented scientific dataset, preserve its provenance, create an analysis-ready Excel workbook, and verify the result visually and mathematically. The result is a nine-sheet workbook built from 6,319 confirmed planets in the NASA Exoplanet Archive.
Download the finished NASA exoplanet Excel workbook
First, a useful distinction: Sol is a model; Codex is a tool
These names are easy to blur together, but they describe different layers.
| Layer | Role in this project |
|---|---|
| Sol | The model selected for this session. It interpreted the request, reasoned about the data and workbook design, and generated code. |
| Codex | The agentic work environment around the model. It inspected files, researched documentation, ran scripts, created the workbook, rendered every sheet, and iterated on failures. |
| Python | One implementation language used for repeatable data acquisition and independent summary checks. |
| Excel | The artifact a person can open, filter, audit, modify, and share. |
OpenAI describes Codex as an agent that can work across files, tools, and repeatable workflows, including the creation of spreadsheets. That is the important product boundary: a model supplies intelligence, while Codex gives that intelligence a place to act. The exact model available in a Codex session can change; Sol is the model used here, not another name for Codex. See OpenAI’s overview of Codex and its description of the Codex app as a command center for agents.
Python has not disappeared. The syntax barrier has.
This workbook still depends on code. The difference is that I did not need to begin by remembering urllib, CSV parsing rules, Excel chart APIs, or the exact spelling of a conditional-formatting property. I began with intent:
Find a documented open scientific dataset with enough rows for a realistic
Excel demonstration. Preserve a raw snapshot, record the exact query and
retrieval date, and explain any important limitations.
Codex turned that into a concrete data-acquisition plan and generated a Python script. The core is ordinary, readable Python:
from urllib.parse import urlencode
from urllib.request import Request, urlopen

TAP_SYNC_URL = "https://exoplanetarchive.ipac.caltech.edu/TAP/sync"
QUERY = """select
pl_name,hostname,disc_year,discoverymethod,disc_facility,
pl_orbper,pl_orbsmax,pl_rade,pl_bmasse,pl_eqt,
st_teff,sy_dist,sy_snum,sy_pnum
from pscomppars
order by disc_year,pl_name""".replace("\n", " ")

url = f"{TAP_SYNC_URL}?{urlencode({'query': QUERY, 'format': 'csv'})}"
request = Request(url, headers={"User-Agent": "pvjohnston.com-excel-demo/1.0"})
with urlopen(request, timeout=60) as response:
    payload = response.read()
The full script also validates that the response contains at least 1,000 rows, that every row has a planet name, and that the one-row-per-planet table did not unexpectedly return duplicates.
Download the complete data-fetching script
I also asked for an independent summary check. Codex generated another small script that counts host systems and discovery methods and measures coverage of selected scientific fields:
from collections import Counter

years = [int(float(row["disc_year"])) for row in rows if row["disc_year"]]
methods = Counter(row["discoverymethod"] for row in rows if row["discoverymethod"])

summary = {
    "planets": len(rows),
    "host_systems": len({row["hostname"] for row in rows if row["hostname"]}),
    "earliest_discovery_year": min(years),
    "latest_discovery_year": max(years),
    "top_discovery_methods": methods.most_common(10),
}
Download the complete summary script
You can understand the goal of either script without being able to write it from a blank screen. You can also ask Codex to explain a line, add a validation rule, or replace an implementation you do not trust. That is a substantial change in who can automate work—but it is not permission to stop checking the result.
Why NASA exoplanet data?
The NASA Exoplanet Archive’s Table Access Protocol exposes documented tables through reproducible queries. I selected the Planetary Systems Composite Parameters table, pscomppars, because it provides one relatively complete row per confirmed planet and is well suited to population-level exploration. NASA publishes definitions for every field.
There is an important scientific caveat. NASA explains that this composite table can fill different fields from different literature references. A row is useful for broad demographic analysis, but its values may not form one internally self-consistent published solution. The workbook puts that warning on both the dashboard and the Read Me sheet rather than hiding it in a footnote. NASA documents the selection and calculation methodology here.
The archive changes as discoveries and measurements are added, so I froze the exact input used for this article:
Download the 2026-07-10 NASA CSV snapshot
The workbook prompt
The next instruction described the outcome, not the library calls:
Build a polished .xlsx with separate raw and processed sheets, auditable
formulas, a compact dashboard, useful charts, filters, frozen headers, and
clear number formats. Do not hide the analysis logic.
That produced nine sheets:
| Sheet | What it is for |
|---|---|
| Dashboard | Four formula-driven KPIs, two charts, coverage indicators, and the main scientific caveat. |
| Raw Data | The NASA columns and values exactly as retrieved. |
| Processed Data | Readable labels plus formula-derived radius classes, distance bands, and availability flags. |
| Year Summary | Formula-driven annual and cumulative discovery counts. |
| Method Summary | Formula-driven counts and shares for each discovery method. |
| Field Coverage | Completeness checks for orbital, planetary, stellar, and distance fields. |
| Prompt Lab | Natural-language requests paired with live formulas, a formula-driven chart, and conditional formatting. |
| Pivot Analysis | A live discovery-method-by-radius-class cross-tab with totals, a heat map, and the formula shown in the sheet. |
| Read Me | Prompts, query, source URLs, methodology warning, and visible classification thresholds. |
The distinction between raw and processed data matters. Nothing in the raw sheet is silently cleaned or overwritten. The derived classifications live in their own columns, use visible thresholds, and remain ordinary Excel formulas that a reviewer can trace.
Make the translation from prompt to spreadsheet visible
The revised workbook does not merely present the finished analysis. Its Prompt Lab puts four requests beside the live cells and exact Excel formulas that answer them:
| Natural-language request | Formula generated in the workbook |
|---|---|
| Count all confirmed planets in the snapshot. | =COUNTA('Raw Data'!$A$2:$A$6320) |
| What share of planets has a measured radius? | =COUNT('Raw Data'!$H$2:$H$6320)/COUNTA('Raw Data'!$A$2:$A$6320) |
| Find the average radius of transit-discovered planets. | =AVERAGEIF('Processed Data'!$D$2:$D$6320,"Transit",'Processed Data'!$G$2:$G$6320) |
| Classify a planet with a radius of 1.60 Earth radii. | A nested IF formula that reads the visible thresholds on Read Me. |
The result column is not pasted output: those are working in-cell formulas. Change the radius input from 1.60, for example, and the classification recalculates. The sheet also records the requested display format—whole number, percentage, decimal measurement, or text category—because formula logic and presentation are separate parts of a useful workbook.
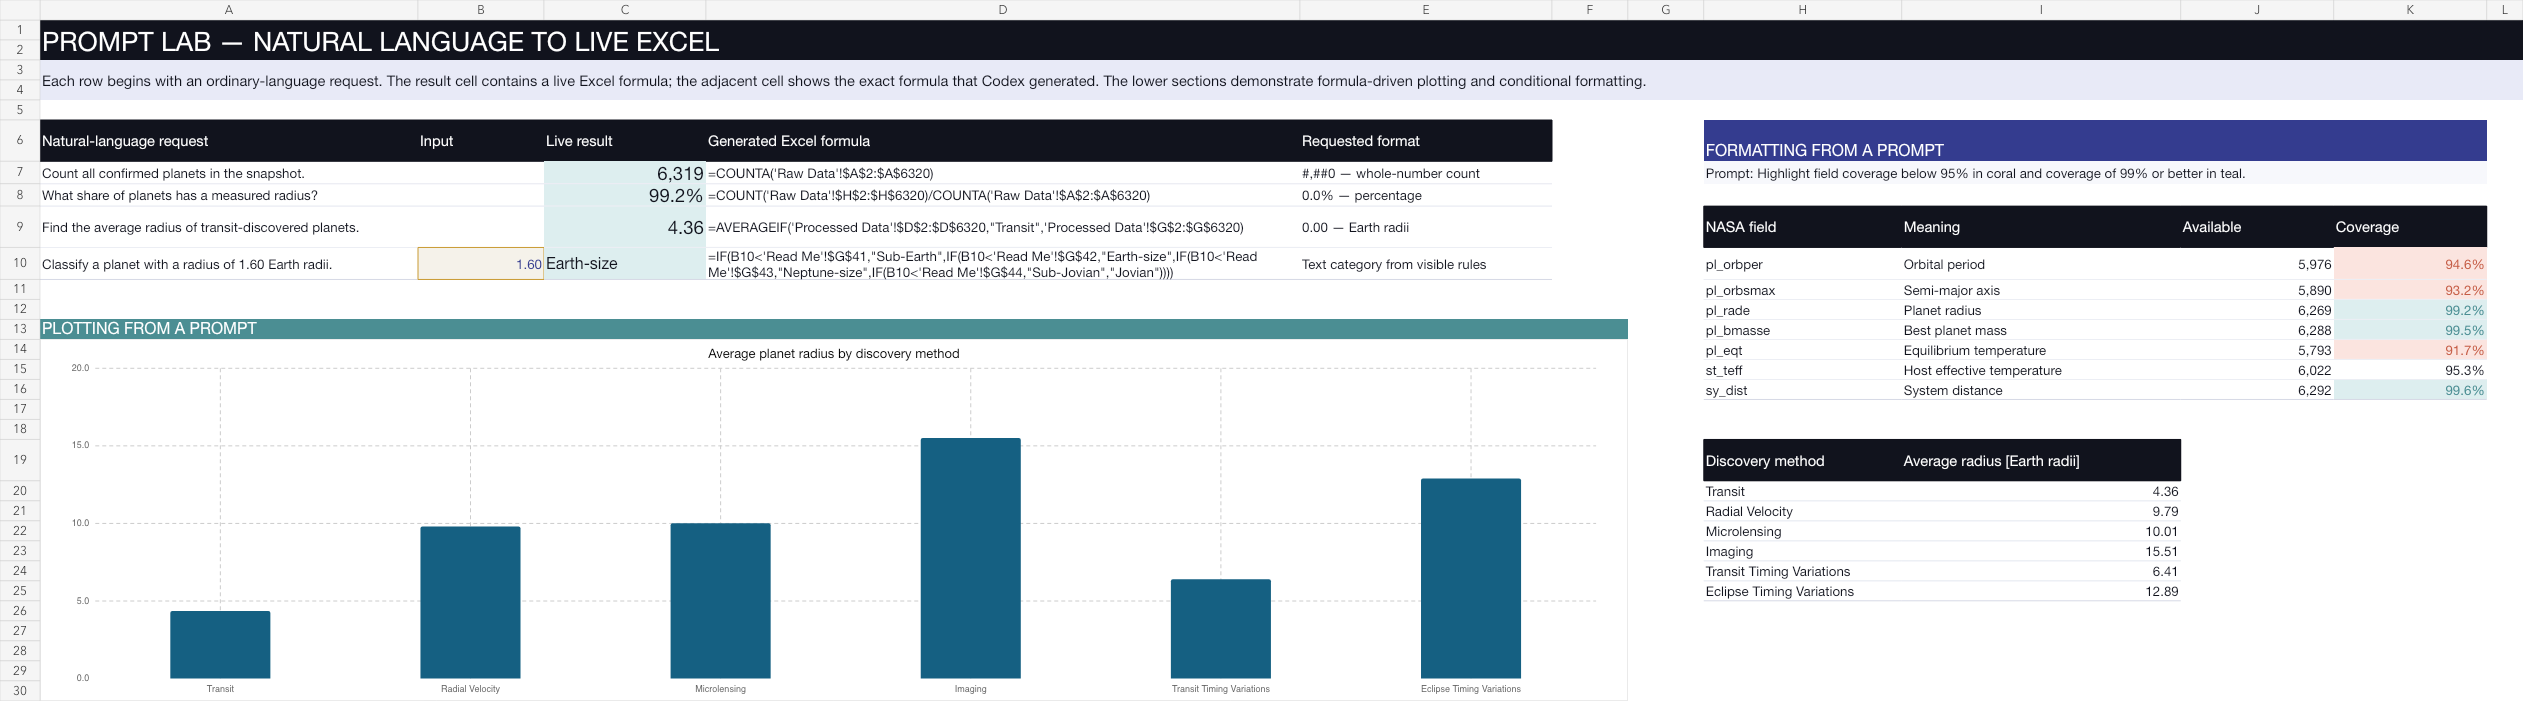
The plotting example starts with another plain-language request: compare average planet radius across the six most common discovery methods. Codex created a helper table whose values are calculated with AVERAGEIF, then bound a native Excel chart to that table. If the source data changes, the table and plot change with it.
Formatting can be requested the same way. “Highlight field coverage below 95% in coral and coverage of 99% or better in teal” became two conditional-formatting rules, not hand-colored cells. The colors therefore continue to describe the values after recalculation.
A pivot-style analysis that remains auditable
I also asked for a pivot table counting planets by discovery method and formula-derived radius class, including row totals, column totals, and a heat map. The workbook builds that cross-tab with live COUNTIFS formulas. Every body cell is inspectable, and the grand total reconciles to all 6,319 planets.
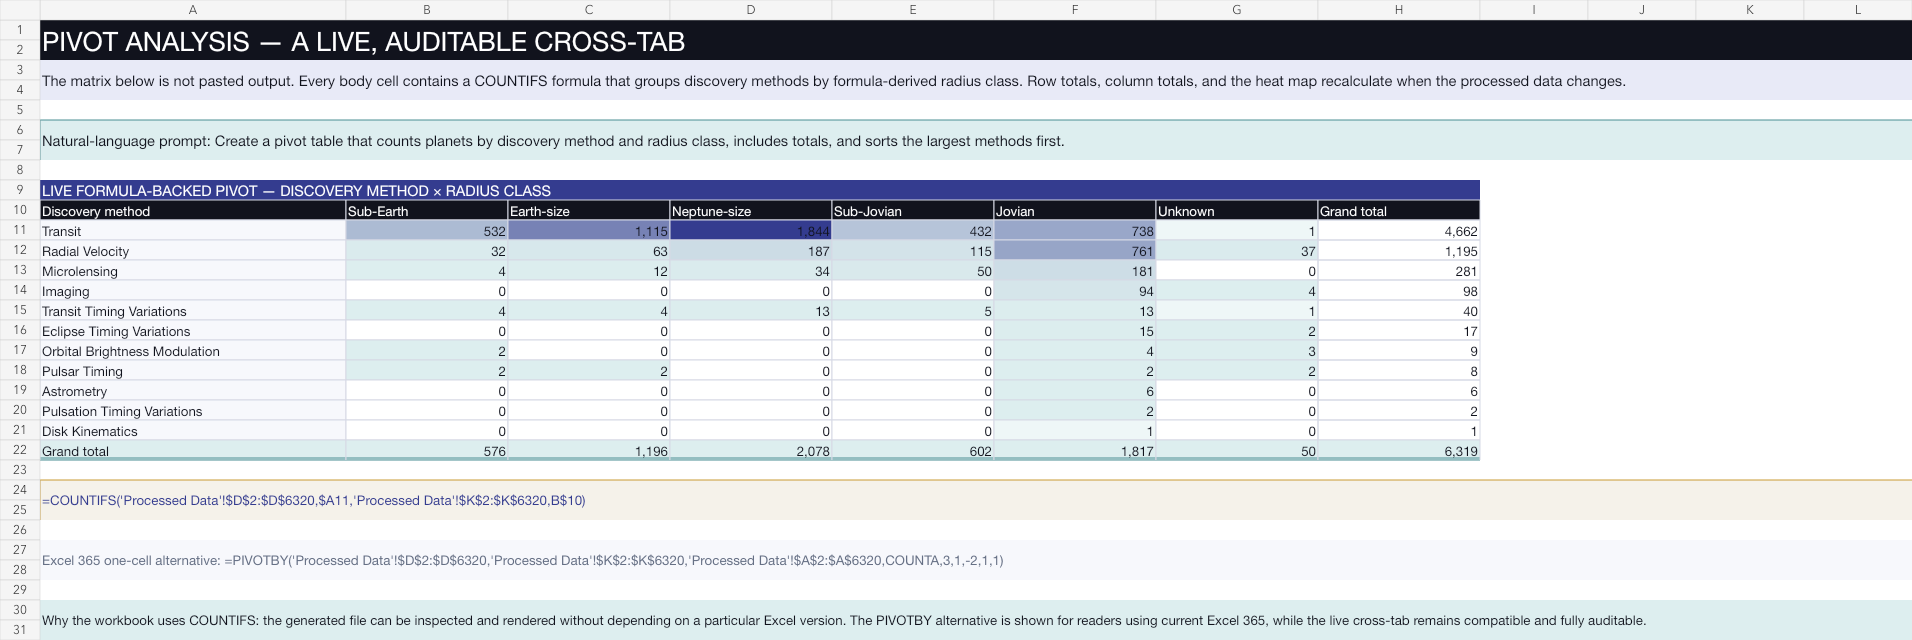
Current Excel 365 releases also offer a compact PIVOTBY formula. The Pivot Analysis sheet displays the equivalent one-cell formula for readers who want to try it. I did not make it the live implementation because the workbook-generation verifier used for this article cannot yet calculate PIVOTBY; using COUNTIFS allowed the generated file to be calculated, rendered, and checked end to end instead of shipping an unverified result.
The prompt that matters most: verify it
A plausible-looking workbook is not enough. The final instruction was a quality-control specification:
Inspect the KPI formulas and summary ranges, scan for Excel errors, render
every sheet, and fix clipping, broken charts, unreadable colors, and awkward
wrapping before export.
Codex checked the important ranges, confirmed that the annual counts and pivot totals reconcile to 6,319 planets, scanned the workbook for #REF!, #DIV/0!, #VALUE!, #NAME?, and #N/A, and found no matches. It rendered all nine sheets for visual inspection. That last step caught a real export problem: two fractional font sizes rendered correctly but violated a stricter integer requirement in the final Excel serializer. Codex changed them to whole-point sizes, rebuilt the file, and repeated the checks.
This is why I think of Codex as more than a code generator. The valuable loop is:
- describe the deliverable;
- let the model propose and implement it;
- inspect the evidence;
- correct problems; and
- export something another person can audit.
What natural language does—and does not—replace
You do not need to understand Python syntax to ask for this workbook, download it, filter the data, or request a revision. You do need enough domain judgment to say what a trustworthy result should contain.
For this example, human judgment still determined that:
- a changing archive requires a dated snapshot;
- raw data must remain separate from transformations;
- missing values are not zeroes;
- 2026 is a partial year and should be labeled as such;
- a composite scientific table needs a visible consistency warning; and
- formula checks and visual rendering belong in the definition of “done.”
The safest mental model is not “AI means I no longer need technical knowledge.” It is “AI lets me work at the level of requirements, questions, and verification while it handles much of the syntax.” That opens spreadsheet automation to far more people without making correctness automatic.
Try the workflow yourself
Download the CSV, attach it to a Codex task, and start with this:
Create an Excel workbook from this NASA exoplanet CSV. Preserve an untouched
raw-data sheet. Add an analysis-friendly sheet with clearly documented derived
fields, formula-driven summaries by year and discovery method, a compact
dashboard, and a Read Me sheet with provenance and limitations. Render and
inspect every sheet, scan for formula errors, and give me the finished .xlsx.
Then make the workbook yours. Ask for a habitable-zone screening sheet, a comparison of discovery methods over time, a chart focused on nearby systems, or a teaching version with definitions beside every scientific field. You can refine the analytical question in ordinary language and let Codex handle the repetitive implementation work.
That is the shift I find exciting: the rich Excel workbook is no longer the reward for already knowing every required tool. It can be the starting point for learning, questioning, and doing better analysis.